
What goes up must come down
Spinnin’ wheel got to go ‘round
Talkin’ ‘bout your troubles it’s a cryin’ sin
Ride a painted pony let the spinnin’ wheel spin
Did you find the directing sign on the
Straight and narrow highway
Would you mind a reflecting sign
Just let it shine within your mind
And show you the colors that are real
–Lyrics from Blood Sweat and Tears late 60s/early 70s hit song, “Spinning Wheel”
Equity Returns Cause Fewer Optimistic Investors
Equity returns for February were “less worse” than January but that’s the kindest way we could phrase it. Specifically, the S&P 500 gave up about 3% in value in this year’s second month versus the roughly 5% decline in its first month,1 but it felt just as bad or worse regarding investor mood. Per Investors’ Intelligence, the ratio of bullish investors to bearish investors stands at a very low level of 1.04, meaning there are currently far fewer optimists than average.2 Ironically, this is a contrarian signal in that historically when investors have become this skeptical, returns have been quite solid going forward.
Regardless, we find large cap U.S. stocks down a tad more than 8% on a year-to-date basis going into the final month of the first quarter, with U.S. small cap stocks suffering in almost identical fashion. The tech- laden Nasdaq has lagged these well-known indices and finds itself in firm correction territory having fallen by roughly 12% so far this year.3
International equity benchmarks have fared a bit better but are in negative territory as well this year. Bottom line…the headlines are simply depressing at this moment. The “Wall of Worry” appears to be thickening with domestic concerns, such as rising inflation, Federal Reserve policy shifts and peaking economic data, which is commanding serious investor attention.
Intra-Year Market Correction Expected
That said, it was the geopolitical landscape that took center stage as we moved through the month of February. Russia’s decision to invade Ukraine put a huge exclamation point on investor concerns. What’s our take on all of this? Our view hasn’t changed much since we introduced our 2022 Crystal Ball Outlook in January. We still look for mid- to high-single-digit returns for the S&P 500 in 2022.
That said, we cautioned investors in our 2022 Outlook on two major fronts and continue to do that today. First, we encouraged investors to steel up for an intra-year correction, which could be in a sizable 15%-20% range and urged them not to freak out.
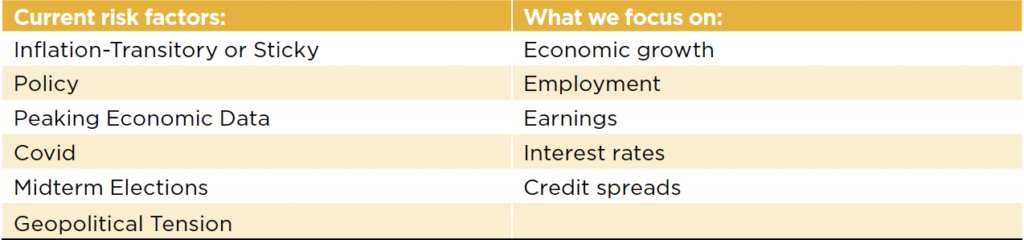
We believe the “Wall of Worry” issues outlined on the left-hand side of the chart below will be in the headlines and will linger for quite a few months in 2022. However, after conducting thorough research, we believe at this time that they will be resolved in adequate fashion.
Current Wall Of Worry Items
These issues will cause heightened volatility and short-term periods of pullbacks and drawdowns in the early goings of this year, but we expect the market to reach higher highs as we move into year-end and into 2023. The calm investors enjoyed in 2021, with nary a drawdown in the S&P 500, as well as the very low volatility over the last three years, is the abnormality here not the heightened and more normal volatility we are seeing once again this year.
Investors Might Need To Rebalance Their Portfolios
Our second plea in our Crystal Ball Outlook was for clients to make sure they are talking with their wealth advisors about rebalancing. If the robust returns in the S&P 500 had taken them well above their normal long-term targeted allocation to stocks, we have urged folks to discuss the prudence of trimming their stock allocation, which might have drifted higher, back to their normal allocation. We believe this provides investors with the confidence to add to stocks at attractive entry points in an opportunistic fashion, should major short-term pullbacks occur. This practice also helps investors avoid the regret of becoming too greedy following unusually good times in the market.
Again, we are not bearish…we still expect the market to post positive gains for the year. This is based on our assessment of the facts that appear on the right-hand side of the chart above…it is the fundamental data, such as economic growth, earnings, the still historically low level of interest rates and solid condition of the credit markets, etc., that drive equity returns in the longer-term, 12- to 15-month horizon. We find these metrics to be positive. Blood, Sweat and Tears sings in its hit song, “Spinning Wheel,” that the painted pony on the spinnin’ wheel ride may go round and round, but they note it’s important to reflect and look for the colors on that pony that are real. Similarly, we look for the trends in the important fundamental signals flashing in the market that are the true and real drivers of stock prices.
The Geopolitical Scene—Russia/Ukraine And Crisis Events
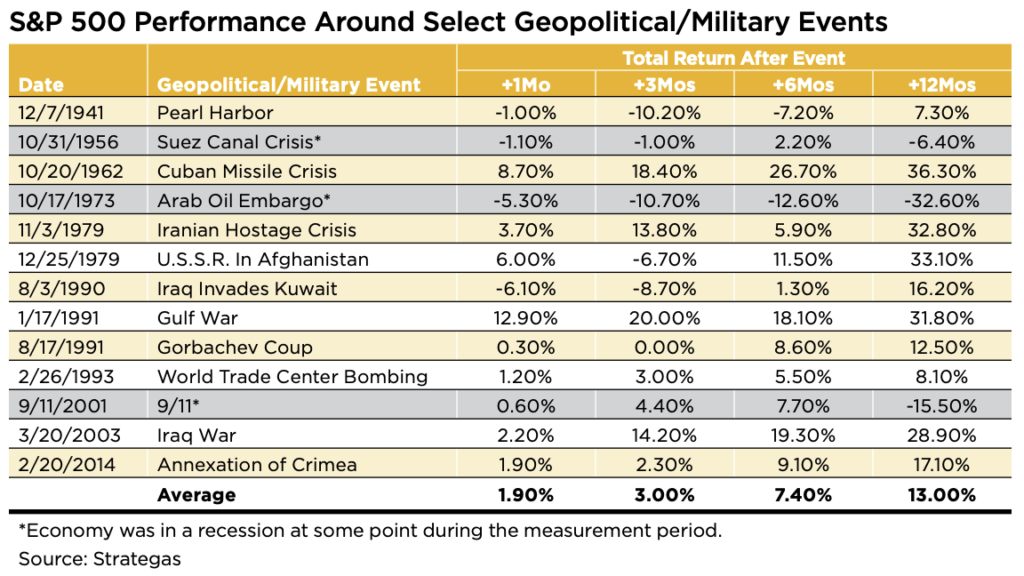
The table below is a reminder that the U.S. stock market has time and again managed quite well during periods of conflict and crisis. Peruse the various events in the past listed in the table, such as the Cuban Missile Crisis, the Gulf War, 9-11, etc., and note that, on average, the temporary drawdowns around the time of crisis outbreak were quickly followed by market rallies. Specifically, on average, the S&P 500 advanced more than 13% in the ensuing 12 months post inception of these various periods of conflict/crisis.
We don’t want to get complacent about the horrible circumstances in Ukraine. We certainly empathize deeply with the human cost being born at this very moment within its borders. Apart from the humanity we must all feel, our job on the investment team is to examine the economic and market consequences of the events in the region. In our research, we conclude, at present, that this should have limited impact on the U.S. economy and should not derail our expectation for positive returns for U.S. stocks this year.
Overview Of Russia’s Economy
First, Russia is not a dominant global economic power that it once was when it was the Soviet Union. It is only the 11th or 12th largest economy in the world at present, depending on the source. Its nominal GDP is one-fourteenth that of the U.S. and 25% smaller than Italy’s output.4 It ranks just a tad ahead of Brazil, Australia, Spain, Mexico and Indonesia, to put things in perspective. The poverty rate in Russia is relatively high, as more than 50 countries have higher GDP per capita including Poland, Hungary, the Czech Republic and Slovakia.5 It is also a relatively small participant in international trade, ranking 20th in the world in exports of goods and services…placing it behind such countries as Switzerland, Belgium and the United Arab Emirates.6 It is the 23rd largest trading partner of the U.S. We export far more to Belgium, for instance, than we do to Russia.7 This, coupled with the fact that the U.S. is much less dependent on foreign oil (in 2020 and 2021, our exports of oil exceeded imports and the U.S. supplies most of our natural gas as well), insulates us from Russian economic decline to a significant degree. Jason Furman, chair of the Council of Economic Advisers under former President Obama, stated it well last week when he was quoted as saying, “Russia is incredibly unimportant in the global economy except for oil and gas basically it is a large gas station.”
So that is the primary risk factor to the global economy. Russia does supply roughly 30% of the European Union’s (EU’s) oil and natural gas.8 As the EU elects to cease the build-out of a major natural gas pipeline project from Russia to its territories, and natural gas supplies are shut off from Russia to its shores, the EU can shift sources of supply to liquified natural gas (LNG) and increase imports from other countries…but not enough in the short term to replace Russian production. This could drive oil and gas prices higher, drive EU inflation higher and slow economic growth in Europe. While 40% of S&P 500 profits are derived from international sources, we do not think this worst-case outcome would derail S&P 500 earnings or our anticipation of positive U.S. equity returns. We say this for the following reasons:
- There are several examples of turmoil and slowing economic growth in Europe that were accompanied by bull market advances in the U.S. To wit, 2012-2016 during concerns of countries potentially exiting the EU and the associated debt crises.
- The price of oil has already surged from $35/bbl. up to more than $100/bbl., so much of the fears of reduced supply are already reflected in fossil fuel prices.
- The markets are not signaling hard landing outcomes at present. The U.S. market bottomed soon after the Russian invasion, and the developed international equity indices have held up quite well and outperformed the U.S. this year.
- Typical signs of looming recession are simply absent. Yes, the yield curve is flattening, but it is not inverted. Historically, the S&P 500 had had some of its greatest moments during a flattening in the yield curve with the mid- to late 90s serving as a case in point. Even if it did invert, the average lag before recession occurs, post inversion, is 11 months, so there should be ample time to adjust strategy should this occur. Finally, the credit markets remain stable, and the level of interest rates are still low and supportive of sustained economic growth and stock market valuation levels.
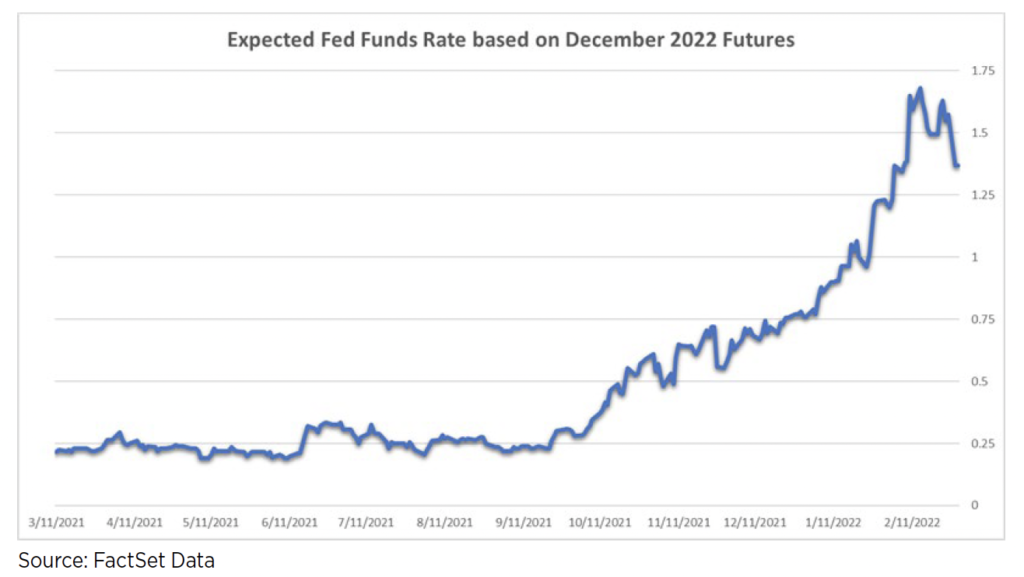
- There are positive economic crosscurrents going on in the U.S. that are by products of this war. For example, the Fed fund futures signal one less rate hike than prior to the time of invasion and suggest that a potential 50 basis point hike in the March meeting is far less likely, so the rising paranoia about more aggressive Fed policy moves has calmed a bit following the inception of this conflict.
Geopolitical Risks And Investor Perception
Let’s remember that investors are quite capable of exaggerating geopolitical risks. In 2016, Brexit was prophesized to cause a global depression…not! That was more than 1,500 points ago in the S&P 500. Yes, the ruble has declined 40% on a year-to-date basis relative to the U.S. dollar, but there are other periods when it has declined almost twice that level and the global stock markets did just fine, e.g., 1998 and 1999.
Quite frankly, we would be much more worried about the market impact of a hard landing in China than we are concerned about the consequences and fallout from the Ukrainian situation. As the second largest economy in the world, a significant slowdown in China’s economy would be a far bigger deal. Here again, we believe that China is providing adequate liquidity in its property market and the People’s Bank of China is the only major central bank in the world lowering rates and providing significant interest rate accommodation to its economy at present. We think such action by the China central bank is prudent and it gives us comfort.
Bottom line, for the time being, our base case is that we see successful resolution of these geopolitical events and witness a typical recovery in the S&P 500 similar to its behavior during and after other crisis events like this that are displayed in the table above. Maybe not right away, but in a very reasonable time frame.
U.S. Fundamentals Still Healthy and Valuation Getting More
Attractive
Economic and earnings data simply remains solid in the U.S. and that is the primary rationale for our conviction that we will see moderate positive returns this year that are in line with the anticipated earnings growth of 8% for the S&P 500 in 2022.
Recent economic releases regarding U.S. retail sales, consumer spending, purchases of durable goods, payroll growth, industrial production and, most recently, manufacturing and service sector activity contained in the Institute of Supply Management surveys were both healthy and better than expected. Fourth quarter earnings have been reported well above prior estimates—actual earnings growth of 32% for the quarter versus prior projections of 22%.9 Profit margins remain at peak levels and have not exhibited the decline due to rising costs that many have feared. We’ll continue to monitor these trends closely.
Inflation To Moderate
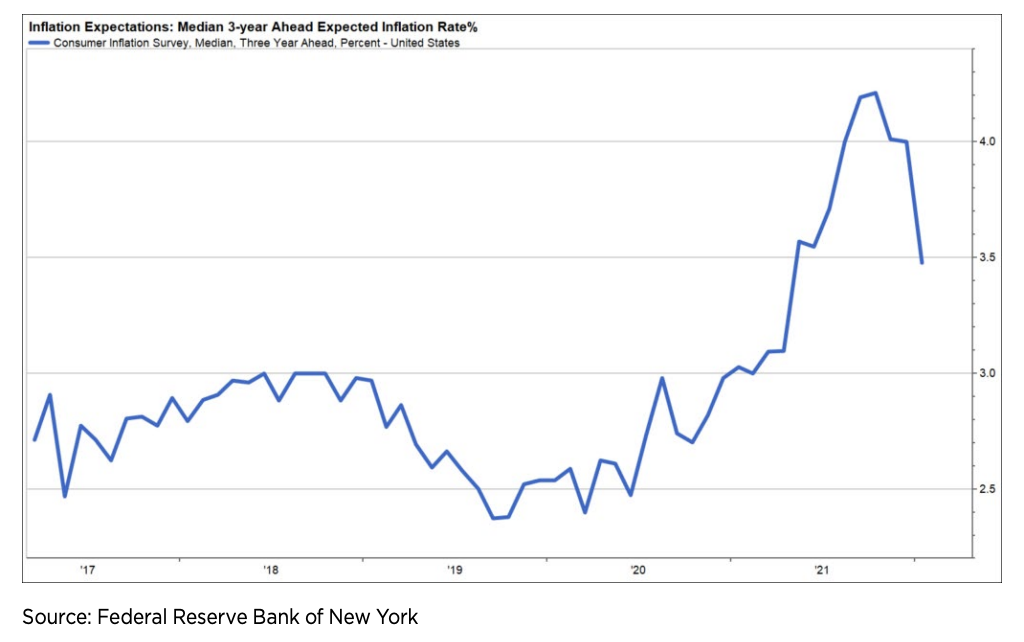
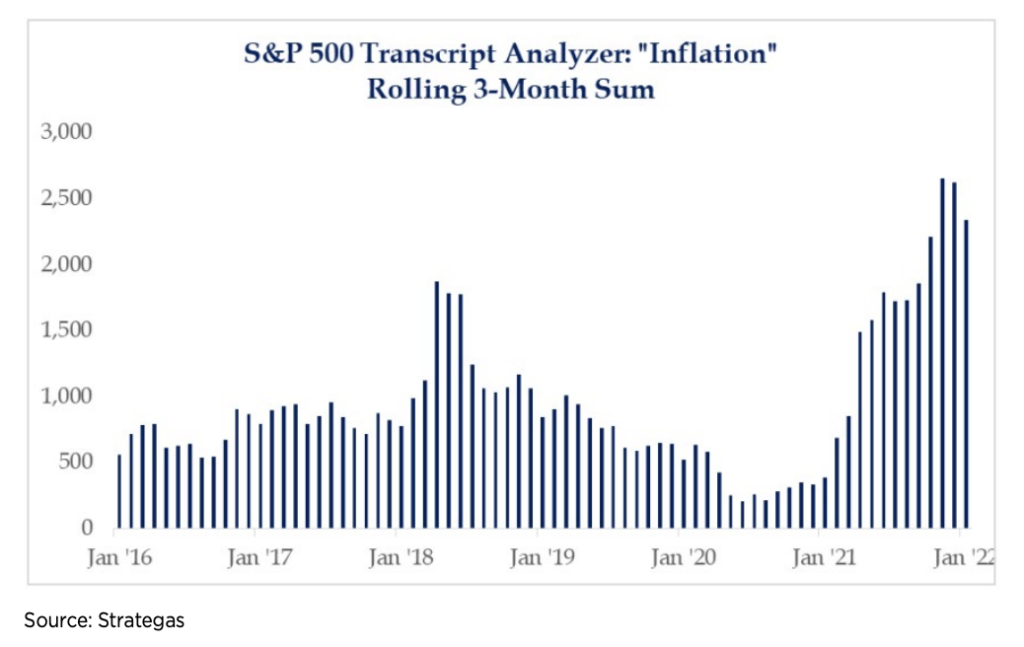
On the inflation front, we continue to expect the Consumer Price Index (CPI) to moderate from the current elevated 6%+ readings to the 3% level by year-end, as supply chain bottlenecks ease, which caused unusually large price increases in odd categories, such as used cars, this past year. While the Russian conflict and its near term potential impact on energy prices won’t make this happen any sooner, we continue to see initial signs of falling inflationary pressures and a peaking of the inflation readings. The charts below are a couple examples of this:
Valuation has become more attractive as P/E levels have declined to a lower level of 19 times earnings from peak levels of 22-23 times earnings.
Wrap-Up
Headline risks are abundant and appear to be growing. However, we believe these issues will be resolved adequately and not lead to worst-case outcomes. At present, key signs of market tops and recession are absent. Meanwhile, fundamentals are holding up well, and valuation is more attractive as P/E levels have declined on this disappointing start for stock returns so far in the new year.
In some ways, there are parallels to the 20% correction in 2018. The market sold off back in 2018 due to exaggerated fears about tariff rhetoric with China, a flattening yield curve and shifting Fed policy. At the same time, U.S. fundamentals continued to show solid trends, and valuation became more compelling on the December 2018 pullback. Sound rather familiar? These geopolitical and policy issues are likely to cause elevated volatility and higher drawdowns than we have seen in the past several years, but we suggest holding fast to your long-term strategic allocation in stocks. Interestingly, forward returns historically have been above average following periods of rising policy uncertainty like we are experiencing today. That said, should the conflict in the Ukraine elevate to a point of global war or cause dislocations in the energy or commodity markets to such a degree that signals of looming recession in the US become evident– e.g, inversion of the yield curve, significant decline in manufacturing and service sector activity, a significant widening in credit spreads, and a swift reversal in employment growth–we would clearly change our view. Some strategists in our industry are beginning to reduce their equity targets and prophesize that recession is far more likely in the next 9-12 months. We believe it is premature to do so and this is not our base case!
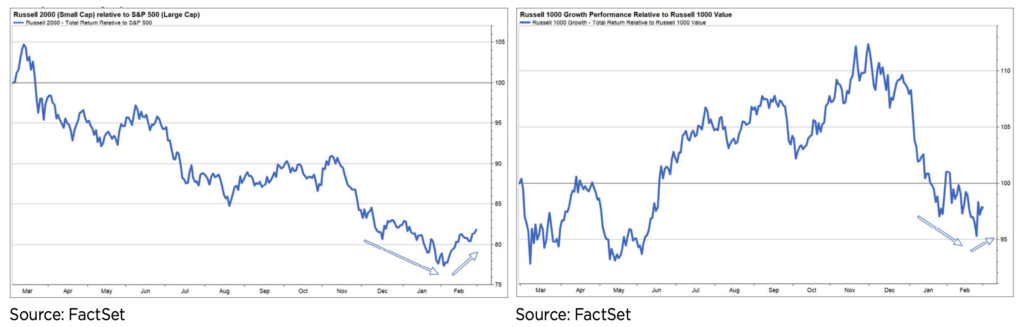
With regard to thoughts about tweaks in positioning equity portfolios in this environment, we recommend maintaining balance in your portfolio. The charts below illustrate that small cap stocks have rebounded a bit this year relative to large caps, and that growth stocks have stabilized and closed the performance gap, versus value stocks during this period of conflict. Small stocks have more domestic revenue exposure versus large caps, and growth stocks are favored in periods of stable interest rates and modestly slower economic growth, both of which we have seen of late. The point is that during this period of heightened volatility and angst over headline, “Wall of Worry” issues, it is no time to be a hero and to take extreme positions diversification and balance in your stock allocation is key!!
Sources:
1FactSet
2 Yardeni
3 FactSet
4 International Monetary Fund, GDP, Current Prices
5 International Monetary Fund, GDP Per Capita, Current Prices
6 The World Bank, Exports of Goods and Services
7 United States Census, FT900: International Trade in Goods and Services
The S&P 500 Index is a market-value weighted index provided by Standard & Poor’s and is comprised of 500 companies chosen for market size and industry group representation.
The Nasdaq Composite Index is the market capitalization-weighted index of over 3,300 common equities listed on the Nasdaq stock exchange.
The value of investments held by any strategy may increase or decrease in response to economic, and financial events (whether real, expected or perceived) in the U.S. and global markets. The value of equity securities is sensitive to stock market volatility. Investments in foreign instruments or currencies can involve greater risk and volatility than U.S. investments because of adverse market, economic, political, regulatory, geopolitical, currency exchange rates or other conditions. In emerging countries, these risks may be more significant.
Asset allocation and/or diversification is a strategy designed to manage risk but it cannot ensure a profit or protect against loss in a declining market. This commentary is limited to the dissemination of general information pertaining to Mariner Wealth Advisors’ investment advisory services and general economic market conditions. The views expressed are for commentary purposes only and do not take into account any individual personal, financial, or tax considerations. As such, the information contained herein is not intended to be personal legal, investment or tax advice or a solicitation to buy or sell any security or engage in a particular investment strategy. Nothing herein should be relied upon as such, and there is no guarantee that any claims made will come to pass. Any opinions and forecasts contained herein are based on information and sources of information deemed to be reliable, but Mariner Wealth Advisors does not warrant the accuracy of the information that this opinion and forecast is based upon. You should note that the materials are provided “as is” without any express or implied warranties. Opinions expressed are subject to change without notice and are not intended as investment advice or to predict future performance. Past performance does not guarantee future results. Consult your financial professional before making any investment decision.
Investment advisory services provided through Mariner Platform Solutions, LLC (“MPS”). MPS is an investment adviser registered with the SEC, headquartered in Overland Park, Kansas. Registration of an investment advisor does not imply a certain level of skill or training. MPS is in compliance with the current notice filing requirements imposed upon registered investment advisers by those states in which MPS transacts business and maintains clients. MPS is either notice filed or qualifies for an exemption or exclusion from notice filing requirements in those states. Any subsequent, direct communication by MPS with a prospective client shall be conducted by a representative that is either registered or qualifies for an exemption or exclusion from registration in the state where the prospective client resides. For additional information about MPS, including fees and services, please contact MPS or refer to the Investment Adviser Public Disclosure website (www.adviserinfo.sec.gov). Please read the disclosure statement carefully before you invest or send money.
Investment Adviser Representatives (“IARs”) are independent contractors of MPS and generally maintain or affiliate with a separate business entity through which they market their services. The separate business entity is not owned, controlled by or affiliated with MPS and is not registered with the SEC. Please refer to the disclosure statement of MPS for additional information.
What goes up must come down
Spinnin’ wheel got to go ‘round
Talkin’ ‘bout your troubles it’s a cryin’ sin
Ride a painted pony let the spinnin’ wheel spin
Did you find the directing sign on the
Straight and narrow highway
Would you mind a reflecting sign
Just let it shine within your mind
And show you the colors that are real
–Lyrics from Blood Sweat and Tears late 60s/early 70s hit song, “Spinning Wheel”
Equity Returns Cause Fewer Optimistic Investors
Equity returns for February were “less worse” than January but that’s the kindest way we could phrase it. Specifically, the S&P 500 gave up about 3% in value in this year’s second month versus the roughly 5% decline in its first month,1 but it felt just as bad or worse regarding investor mood. Per Investors’ Intelligence, the ratio of bullish investors to bearish investors stands at a very low level of 1.04, meaning there are currently far fewer optimists than average.2 Ironically, this is a contrarian signal in that historically when investors have become this skeptical, returns have been quite solid going forward.
Regardless, we find large cap U.S. stocks down a tad more than 8% on a year-to-date basis going into the final month of the first quarter, with U.S. small cap stocks suffering in almost identical fashion. The tech- laden Nasdaq has lagged these well-known indices and finds itself in firm correction territory having fallen by roughly 12% so far this year.3
International equity benchmarks have fared a bit better but are in negative territory as well this year. Bottom line…the headlines are simply depressing at this moment. The “Wall of Worry” appears to be thickening with domestic concerns, such as rising inflation, Federal Reserve policy shifts and peaking economic data, which is commanding serious investor attention.
Intra-Year Market Correction Expected
That said, it was the geopolitical landscape that took center stage as we moved through the month of February. Russia’s decision to invade Ukraine put a huge exclamation point on investor concerns. What’s our take on all of this? Our view hasn’t changed much since we introduced our 2022 Crystal Ball Outlook in January. We still look for mid- to high-single-digit returns for the S&P 500 in 2022.
That said, we cautioned investors in our 2022 Outlook on two major fronts and continue to do that today. First, we encouraged investors to steel up for an intra-year correction, which could be in a sizable 15%-20% range and urged them not to freak out.
We believe the “Wall of Worry” issues outlined on the left-hand side of the chart below will be in the headlines and will linger for quite a few months in 2022. However, after conducting thorough research, we believe at this time that they will be resolved in adequate fashion.
Current Wall Of Worry Items
These issues will cause heightened volatility and short-term periods of pullbacks and drawdowns in the early goings of this year, but we expect the market to reach higher highs as we move into year-end and into 2023. The calm investors enjoyed in 2021, with nary a drawdown in the S&P 500, as well as the very low volatility over the last three years, is the abnormality here not the heightened and more normal volatility we are seeing once again this year.
Investors Might Need To Rebalance Their Portfolios
Our second plea in our Crystal Ball Outlook was for clients to make sure they are talking with their wealth advisors about rebalancing. If the robust returns in the S&P 500 had taken them well above their normal long-term targeted allocation to stocks, we have urged folks to discuss the prudence of trimming their stock allocation, which might have drifted higher, back to their normal allocation. We believe this provides investors with the confidence to add to stocks at attractive entry points in an opportunistic fashion, should major short-term pullbacks occur. This practice also helps investors avoid the regret of becoming too greedy following unusually good times in the market.
Again, we are not bearish…we still expect the market to post positive gains for the year. This is based on our assessment of the facts that appear on the right-hand side of the chart above…it is the fundamental data, such as economic growth, earnings, the still historically low level of interest rates and solid condition of the credit markets, etc., that drive equity returns in the longer-term, 12- to 15-month horizon. We find these metrics to be positive. Blood, Sweat and Tears sings in its hit song, “Spinning Wheel,” that the painted pony on the spinnin’ wheel ride may go round and round, but they note it’s important to reflect and look for the colors on that pony that are real. Similarly, we look for the trends in the important fundamental signals flashing in the market that are the true and real drivers of stock prices.
The Geopolitical Scene—Russia/Ukraine And Crisis Events
The table below is a reminder that the U.S. stock market has time and again managed quite well during periods of conflict and crisis. Peruse the various events in the past listed in the table, such as the Cuban Missile Crisis, the Gulf War, 9-11, etc., and note that, on average, the temporary drawdowns around the time of crisis outbreak were quickly followed by market rallies. Specifically, on average, the S&P 500 advanced more than 13% in the ensuing 12 months post inception of these various periods of conflict/crisis.
We don’t want to get complacent about the horrible circumstances in Ukraine. We certainly empathize deeply with the human cost being born at this very moment within its borders. Apart from the humanity we must all feel, our job on the investment team is to examine the economic and market consequences of the events in the region. In our research, we conclude, at present, that this should have limited impact on the U.S. economy and should not derail our expectation for positive returns for U.S. stocks this year.
Overview Of Russia’s Economy
First, Russia is not a dominant global economic power that it once was when it was the Soviet Union. It is only the 11th or 12th largest economy in the world at present, depending on the source. Its nominal GDP is one-fourteenth that of the U.S. and 25% smaller than Italy’s output.4 It ranks just a tad ahead of Brazil, Australia, Spain, Mexico and Indonesia, to put things in perspective. The poverty rate in Russia is relatively high, as more than 50 countries have higher GDP per capita including Poland, Hungary, the Czech Republic and Slovakia.5 It is also a relatively small participant in international trade, ranking 20th in the world in exports of goods and services…placing it behind such countries as Switzerland, Belgium and the United Arab Emirates.6 It is the 23rd largest trading partner of the U.S. We export far more to Belgium, for instance, than we do to Russia.7 This, coupled with the fact that the U.S. is much less dependent on foreign oil (in 2020 and 2021, our exports of oil exceeded imports and the U.S. supplies most of our natural gas as well), insulates us from Russian economic decline to a significant degree. Jason Furman, chair of the Council of Economic Advisers under former President Obama, stated it well last week when he was quoted as saying, “Russia is incredibly unimportant in the global economy except for oil and gas basically it is a large gas station.”
So that is the primary risk factor to the global economy. Russia does supply roughly 30% of the European Union’s (EU’s) oil and natural gas.8 As the EU elects to cease the build-out of a major natural gas pipeline project from Russia to its territories, and natural gas supplies are shut off from Russia to its shores, the EU can shift sources of supply to liquified natural gas (LNG) and increase imports from other countries…but not enough in the short term to replace Russian production. This could drive oil and gas prices higher, drive EU inflation higher and slow economic growth in Europe. While 40% of S&P 500 profits are derived from international sources, we do not think this worst-case outcome would derail S&P 500 earnings or our anticipation of positive U.S. equity returns. We say this for the following reasons:
- There are several examples of turmoil and slowing economic growth in Europe that were accompanied by bull market advances in the U.S. To wit, 2012-2016 during concerns of countries potentially exiting the EU and the associated debt crises.
- The price of oil has already surged from $35/bbl. up to more than $100/bbl., so much of the fears of reduced supply are already reflected in fossil fuel prices.
- The markets are not signaling hard landing outcomes at present. The U.S. market bottomed soon after the Russian invasion, and the developed international equity indices have held up quite well and outperformed the U.S. this year.
- Typical signs of looming recession are simply absent. Yes, the yield curve is flattening, but it is not inverted. Historically, the S&P 500 had had some of its greatest moments during a flattening in the yield curve with the mid- to late 90s serving as a case in point. Even if it did invert, the average lag before recession occurs, post inversion, is 11 months, so there should be ample time to adjust strategy should this occur. Finally, the credit markets remain stable, and the level of interest rates are still low and supportive of sustained economic growth and stock market valuation levels.
- There are positive economic crosscurrents going on in the U.S. that are by products of this war. For example, the Fed fund futures signal one less rate hike than prior to the time of invasion and suggest that a potential 50 basis point hike in the March meeting is far less likely, so the rising paranoia about more aggressive Fed policy moves has calmed a bit following the inception of this conflict.
Geopolitical Risks And Investor Perception
Let’s remember that investors are quite capable of exaggerating geopolitical risks. In 2016, Brexit was prophesized to cause a global depression…not! That was more than 1,500 points ago in the S&P 500. Yes, the ruble has declined 40% on a year-to-date basis relative to the U.S. dollar, but there are other periods when it has declined almost twice that level and the global stock markets did just fine, e.g., 1998 and 1999.
Quite frankly, we would be much more worried about the market impact of a hard landing in China than we are concerned about the consequences and fallout from the Ukrainian situation. As the second largest economy in the world, a significant slowdown in China’s economy would be a far bigger deal. Here again, we believe that China is providing adequate liquidity in its property market and the People’s Bank of China is the only major central bank in the world lowering rates and providing significant interest rate accommodation to its economy at present. We think such action by the China central bank is prudent and it gives us comfort.
Bottom line, for the time being, our base case is that we see successful resolution of these geopolitical events and witness a typical recovery in the S&P 500 similar to its behavior during and after other crisis events like this that are displayed in the table above. Maybe not right away, but in a very reasonable time frame.
U.S. Fundamentals Still Healthy and Valuation Getting More
Attractive
Economic and earnings data simply remains solid in the U.S. and that is the primary rationale for our conviction that we will see moderate positive returns this year that are in line with the anticipated earnings growth of 8% for the S&P 500 in 2022.
Recent economic releases regarding U.S. retail sales, consumer spending, purchases of durable goods, payroll growth, industrial production and, most recently, manufacturing and service sector activity contained in the Institute of Supply Management surveys were both healthy and better than expected. Fourth quarter earnings have been reported well above prior estimates—actual earnings growth of 32% for the quarter versus prior projections of 22%.9 Profit margins remain at peak levels and have not exhibited the decline due to rising costs that many have feared. We’ll continue to monitor these trends closely.
Inflation To Moderate
On the inflation front, we continue to expect the Consumer Price Index (CPI) to moderate from the current elevated 6%+ readings to the 3% level by year-end, as supply chain bottlenecks ease, which caused unusually large price increases in odd categories, such as used cars, this past year. While the Russian conflict and its near term potential impact on energy prices won’t make this happen any sooner, we continue to see initial signs of falling inflationary pressures and a peaking of the inflation readings. The charts below are a couple examples of this:
Valuation has become more attractive as P/E levels have declined to a lower level of 19 times earnings from peak levels of 22-23 times earnings.
Wrap-Up
Headline risks are abundant and appear to be growing. However, we believe these issues will be resolved adequately and not lead to worst-case outcomes. At present, key signs of market tops and recession are absent. Meanwhile, fundamentals are holding up well, and valuation is more attractive as P/E levels have declined on this disappointing start for stock returns so far in the new year.
In some ways, there are parallels to the 20% correction in 2018. The market sold off back in 2018 due to exaggerated fears about tariff rhetoric with China, a flattening yield curve and shifting Fed policy. At the same time, U.S. fundamentals continued to show solid trends, and valuation became more compelling on the December 2018 pullback. Sound rather familiar? These geopolitical and policy issues are likely to cause elevated volatility and higher drawdowns than we have seen in the past several years, but we suggest holding fast to your long-term strategic allocation in stocks. Interestingly, forward returns historically have been above average following periods of rising policy uncertainty like we are experiencing today. That said, should the conflict in the Ukraine elevate to a point of global war or cause dislocations in the energy or commodity markets to such a degree that signals of looming recession in the US become evident– e.g, inversion of the yield curve, significant decline in manufacturing and service sector activity, a significant widening in credit spreads, and a swift reversal in employment growth–we would clearly change our view. Some strategists in our industry are beginning to reduce their equity targets and prophesize that recession is far more likely in the next 9-12 months. We believe it is premature to do so and this is not our base case!
With regard to thoughts about tweaks in positioning equity portfolios in this environment, we recommend maintaining balance in your portfolio. The charts below illustrate that small cap stocks have rebounded a bit this year relative to large caps, and that growth stocks have stabilized and closed the performance gap, versus value stocks during this period of conflict. Small stocks have more domestic revenue exposure versus large caps, and growth stocks are favored in periods of stable interest rates and modestly slower economic growth, both of which we have seen of late. The point is that during this period of heightened volatility and angst over headline, “Wall of Worry” issues, it is no time to be a hero and to take extreme positions diversification and balance in your stock allocation is key!!
Sources:
1FactSet
2 Yardeni
3 FactSet
4 International Monetary Fund, GDP, Current Prices
5 International Monetary Fund, GDP Per Capita, Current Prices
6 The World Bank, Exports of Goods and Services
7 United States Census, FT900: International Trade in Goods and Services
The S&P 500 Index is a market-value weighted index provided by Standard & Poor’s and is comprised of 500 companies chosen for market size and industry group representation.
The Nasdaq Composite Index is the market capitalization-weighted index of over 3,300 common equities listed on the Nasdaq stock exchange.
The value of investments held by any strategy may increase or decrease in response to economic, and financial events (whether real, expected or perceived) in the U.S. and global markets. The value of equity securities is sensitive to stock market volatility. Investments in foreign instruments or currencies can involve greater risk and volatility than U.S. investments because of adverse market, economic, political, regulatory, geopolitical, currency exchange rates or other conditions. In emerging countries, these risks may be more significant.
Asset allocation and/or diversification is a strategy designed to manage risk but it cannot ensure a profit or protect against loss in a declining market. This commentary is limited to the dissemination of general information pertaining to Mariner Wealth Advisors’ investment advisory services and general economic market conditions. The views expressed are for commentary purposes only and do not take into account any individual personal, financial, or tax considerations. As such, the information contained herein is not intended to be personal legal, investment or tax advice or a solicitation to buy or sell any security or engage in a particular investment strategy. Nothing herein should be relied upon as such, and there is no guarantee that any claims made will come to pass. Any opinions and forecasts contained herein are based on information and sources of information deemed to be reliable, but Mariner Wealth Advisors does not warrant the accuracy of the information that this opinion and forecast is based upon. You should note that the materials are provided “as is” without any express or implied warranties. Opinions expressed are subject to change without notice and are not intended as investment advice or to predict future performance. Past performance does not guarantee future results. Consult your financial professional before making any investment decision.
Investment advisory services provided through Mariner Platform Solutions, LLC (“MPS”). MPS is an investment adviser registered with the SEC, headquartered in Overland Park, Kansas. Registration of an investment advisor does not imply a certain level of skill or training. MPS is in compliance with the current notice filing requirements imposed upon registered investment advisers by those states in which MPS transacts business and maintains clients. MPS is either notice filed or qualifies for an exemption or exclusion from notice filing requirements in those states. Any subsequent, direct communication by MPS with a prospective client shall be conducted by a representative that is either registered or qualifies for an exemption or exclusion from registration in the state where the prospective client resides. For additional information about MPS, including fees and services, please contact MPS or refer to the Investment Adviser Public Disclosure website (www.adviserinfo.sec.gov). Please read the disclosure statement carefully before you invest or send money.
Investment Adviser Representatives (“IARs”) are independent contractors of MPS and generally maintain or affiliate with a separate business entity through which they market their services. The separate business entity is not owned, controlled by or affiliated with MPS and is not registered with the SEC. Please refer to the disclosure statement of MPS for additional information.
What goes up must come down
Spinnin’ wheel got to go ‘round
Talkin’ ‘bout your troubles it’s a cryin’ sin
Ride a painted pony let the spinnin’ wheel spin
Did you find the directing sign on the
Straight and narrow highway
Would you mind a reflecting sign
Just let it shine within your mind
And show you the colors that are real
–Lyrics from Blood Sweat and Tears late 60s/early 70s hit song, “Spinning Wheel”