

You’ve got yourself stuck in a moment, And now you can’t get out of it.— Chorus from a U2 song
Not much has changed in the last six months, going all the way back to November 2022. Since then, the S&P 500 has traded in a relatively tight range of somewhere between 3,800 and 4,200. Right now, we happen to be at the top end of that trading range. While the specific wall of worry items may have changed a bit, the general facts have remained pretty much the same during this time span.
The Data is Looking Up
On that score, inflation is trending better and seems much less worrisome to us, and corporate earnings reports are better than feared this quarter with the banks and key technology companies beating estimates and acting in a more optimistic fashion than anticipated. The world has adjusted more effectively than originally thought regarding economic contagion from the Russia/Ukraine conflict, and the harshest moments of hawkish Federal Reserve rhetoric should be nearing an end.
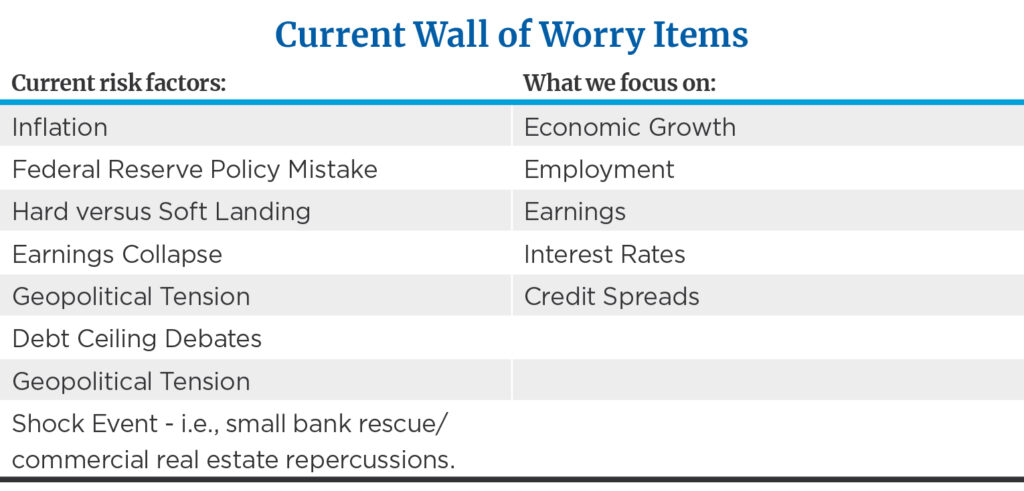
What’s Worrying Investors
However, on the “cons” side of the wall of worry ledger, the condition of our banking system and the peak season for debt ceiling discussions are causing investors added angst. Our take? We are passionate bores at present and are, ironically, as excited as could be to preach “be dull” as the message of the day. Patience is key!
We continue to believe that the S&P 500 is headed toward a price level of 4,500 or better by year-end, but that we could be stuck in a trading range for a quarter or so more before we pierce through that stubborn 4,200 resistance point. We could even retest those October 2022 lows before reaching that 4,500+ “promised land” as the economy and market battle through this transition period and the associated wall of worry concerns. We guided clients to pare back allocations to normal, long-term targets in early 2022 on the heels of robust returns in the prior three years. Those prior returns took clients’ stock exposure handsomely above normal levels. We have suggested “holding your ground” since then. We have cautioned clients to stay put. We continue to advise that you know what you want to own. However, from an allocation standpoint, we have urged clients not to “buy on dips” or sell further. That’s been our advice—be boring and wait with a robust buy list in hand.
The Market and Economy: Stuck in Neutral
Both the bulls and the bears have arguments for how the market and economy might behave and each can support their cases with data.The extreme views of “all is lost” or “all is clear” are misguided. Neither is accurate based on research and the facts. We’re tied in the game at the commercial break, so to speak. The economic data is neutral, earnings data is neutral, conditions in the credit markets and rate trend are neutral, the technical backdrop of the stock market is neutral… and hence, so is our message:
- The Economy. Key indicators—such as manufacturing and service sector activity, the leading economic indicators index and housing—are weakening. That said, employment, consumer spending and coincident economic indicators are solid. Q1 gross domestic product is estimated to pace at an underwhelming overall speed of 1.1% real growth, yet the consumer is driving real final sales growth of more than 3.7% (quite impressive), offset by a restocking of inventories and associated drawdowns that act as a temporary drag on production. Inflation is easing yet is still higher than desired by policy makers.1 Conclusion: Mixed Bag… Neutral!
- Earnings. They are slowing in Q1, and Q2 earnings per share (EPS) will show a decline/negative trend.2 Yet, history shows short-term earnings swings do not correlate with weak stock market returns. Nine of the 11 prior periods of earnings declines of 10% or more3 going back to 1950 have coincided with positive stock returns in those calendar years because of the anticipatory nature of the stock market, which is always looking forward to future earnings.2024 EPS matter more than 2023 EPS at this juncture. 2023 calendar-year earnings are pretty much old news. Regardless, there’s a pretty good setup for this Q1 2023 earnings season. Folks are expecting the worst, and so far, the earnings numbers being reported are better than feared. JP Morgan’s results are a great example. So are Microsoft’s, Meta’s, McDonald’s, GM’s, etc. Bottom line, the percentage of companies beating expectations is at a normal/neutral level. Conclusion: Mixed Bag… Neutral!
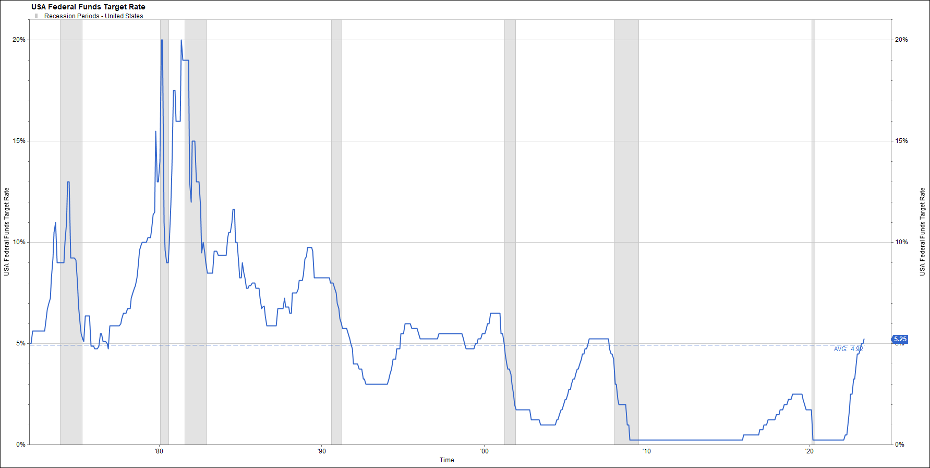
- Credit Conditions/Trend in Interest Rates. We have a deeply inverted yield curve, yet credit spreads are not showing any major signs of stress that normally happen during chapters of inversion. The Federal Reserve has only taken us back to average on fed funds rate levels, and the Fed (after its recent quarter point rate hike) is likely to pause very soon. However, if it keeps pushing both on rates and rhetoric, the Fed could break things. The hike to 5.25% only takes us back to the normal historical average. Conclusion: Mixed Bag… Neutral!
- Stock Market Technicals. Leadership has narrowed, and the risk-on trade has rolled over a bit, yet the losers of last year remain the winners this year by a wide margin on a year-to-date basis, which is a good sign of rising confidence compared to 2022. Insider buying has increased lately. The percentage of stocks trading above the 200-day and 50-day moving average has improved, but remains neutral.4 The percentage of investors who are bearish has declined but not enough to be a contrarian positive; likewise, the percentage of investors who are bullish has risen but not enough to be a contrarian negative. Conclusion: Mixed Bag… Neutral!
Interestingly, despite the issues and the many bullish and bearish arguments put forth by both sides over the last 12 months, the S&P 500 price level is flat over the last year. It’s virtually unmoved from start to end over this time frame. Much ado about nothing? “Hold your ground” seems to us to have been a pretty good strategy to embrace in this environment given that result.
Two Different Paths to New Stock Market Highs
The logic here, in our view, is that we do see the S&P 500 at 4,500 or above toward year-end 2023 or early 2024. But as illustrated above, the data is clearly mixed right now as we march through these transitions regarding Fed policy, inflation levels, economic growth, Washington debates on fiscal policy, etc. We think the first two are moving in a less-worse direction while economic and earnings growth will be okay to better than feared. This thesis should carry us higher over a reasonable period, but we would give equal weight to two different paths to 4,500 over the balance of the year:
- We could easily see a steady, “three yards and a cloud of dust” path wherein the Fed pauses, inflation continues to calm, and we experience some economic weakness in the back half of the year that the market looks through because it sees a mild 2023 slowdown yet, more importantly, a relatively swift recovery in 2024, or
- We could see continued volatility because of negative surprise events that these transitions inspire, such as the recent banking/disintermediation scare, or the upcoming negotiations/gamesmanship employed in congressional and White House talks on how to best lift the debt ceiling. We think it’s fair to conclude a banking crisis has been avoided and has been adequately handled, but the debt ceiling issue might temporarily scare some investors before it just goes away. Fears about a slowdown in 2023 earnings might rattle emotions despite the fact investors should know that the trend in 2024 EPS is what really matters now.
We do tend to think the bottom in the stock market was established in October and expect it to hold based on the neutral fundamental, valuation and technical price trend metrics we see. That said, we can also envision the possibility that fears about the matters mentioned in the second bullet point above could take us back to retest the October 2022 lows of approximately 3,500 in the S&P 500 before we move on in sustained fashion to 4,500+. We would give 50% probability to each of the above scenarios regarding the pace or path to our targets.
The Debt Ceiling: The Sky Is Not Falling?
We have been asked how the current debt ceiling conundrum and associated congressional debates on this subject impact your outlook on the financial markets. We think this is a summer item that will be resolved in “less-than-perfect, yet adequate fashion.” While a temporary issue that will likely be adequately resolved, the volatility the debt ceiling can inspire is one of the reasons we maintain a neutral, “hold your ground” stance for the near term. This concern should be behind us by mid-summer.
Yes, the U.S. stock market sold off nearly 20% in the second half of 2011 when the U.S. debt was downgraded, and that saw the S&P 500 end the full calendar year essentially flat.5 For some reason, this period is what comes to investors’ minds when they hear the phrase “debt ceiling discussions,” much like the negative reflex reaction of immediately envisioning the ugly 1970’s bear market in stocks when one reads about elevated inflationary pressures. However, the 2011 calendar year pullback inspired by fiscal concerns came on the heels of strong stock market returns in 2009, 2010 and in the first half of 2011.6 This is the opposite of the case today, with these discussions arising in the aftermath of a horrible stock market in 2022, and a lot of negative news has been discounted in advance. The precursor performance stage couldn’t be more different going into these congressional discussions versus 2011.
In addition, 2011 was about much more than fiscal debates in the U.S. The world was approaching the apex in a global financial crisis centered on Europe back then. Remember the so-called “PIIGS” countries (Portugal, Italy, Ireland, Greece and Spain), which were working through massive deficits and debt restructurings that required bailouts from the European Union and International Monetary Fund? There were mass protests in these countries related to the austerity measures and tax increases needed to fix this crisis overseas—scary stuff! Spreads were surging on the debt of these foreign countries, and it was a mess on a global scale, which all compounded to impact investor mood that year. Despite all this, the U.S. stock market went on to achieve new highs by April 2012, just a few months after the U.S. debt downgrade, and successful measures were employed to avoid worst-case outcomes in Europe. Hopefully, this provides perspective on the far more benign environment today as these debates begin to play out in Washington.
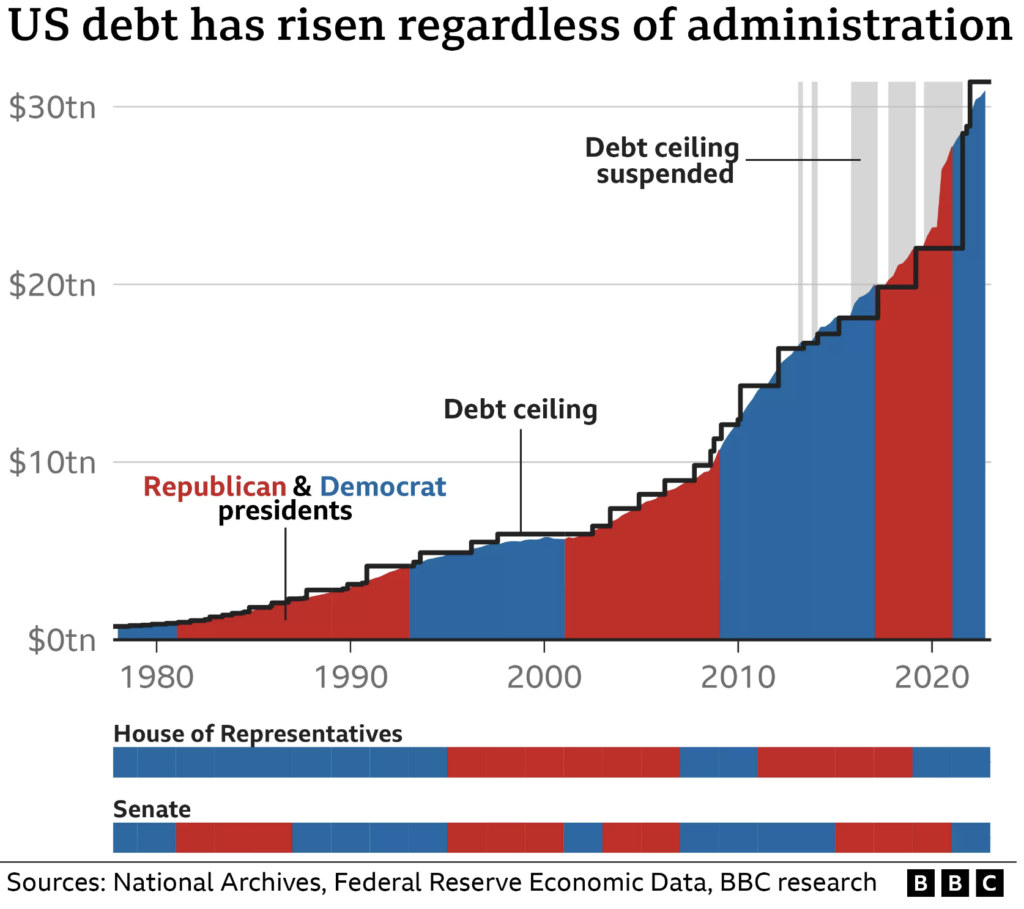
In truth, the concept of a debt ceiling is really a silly thing, as it is not coordinated with the annual government budget resolutions and spending approvals. The spending bills are passed in Congress with full knowledge by all that the approved spending targets will absolutely breach the debt ceiling limits in due time. In our opinion, both parties use the ceiling as a bargaining chip to get their legislation agenda items passed, i.e., “If you want X, you need me to vote to raise the debt ceiling, and I’ll do that if you give me Y.” Eventually someone blinks, agreement is reached and “crisis” is avoided. Both parties have raised or suspended the debt ceiling numerous times going back to the 1980s, and they have done so 20 times alone since 2002! This gamesmanship has become a tradition and clearly is tiresome to us all.
This year is no different. What are the general impacts of all this congressional theater? The data shows that historically, volatility in the stock market increases in the months leading up to the debt ceiling violation date (the X date). Shortly after the eventual vote to suspend it for a period or raise it, volatility stabilizes and resumes prior levels.
Options and Potential Outcomes
Scenario 1: Eventual Bipartisan Passage of a Plan to Lift the Debt Ceiling—Likely.
The GOP members of the House are passionate about lowering the deficit and cutting spending, and they have successfully passed such belt-tightening legislation as part of a debt ceiling package in the House chamber. With a thin majority in the House, it is pretty impressive that they were able to do this, and it actually increases the odds of a bill eventually getting through the Senate and approved by the White House, despite what you may read. No doubt this House bill will be watered down in the Senate. There will probably be some extended brinkmanship here as Senate Democrats and the Biden administration push for a clean debt ceiling increase with no or limited spending cuts. Fortunately, leaders on both sides of the aisle in the Senate support raising the debt ceiling in general, so watered-down bipartisan passage in the House and Senate is possible and likely to occur at the eleventh hour.
Scenario 2: House and Senate Suspend the Debt Ceiling Limit for a Time—Somewhat Likely
There could be some type of legislative action approved in the House and Senate in bipartisan fashion to temporarily suspend the debt ceiling and give the government some breathing room to figure things out with a pledge to do so by some committed date in the future. Like the scenario above, this would relieve the markets, though this too will incur drama and likely come at the eleventh hour. No doubt this simply kicks the can down the road, as is often the case.
Other less likely scenarios include the option for the president to raise the debt limit subject to a congressional motion of disapproval, which he then could veto. This strategy was used by Obama back in 2011 to negotiate with congressional leaders to extend the debt limit until 2013 in conjunction with a pledge to agree to budget cuts by a certain date or face automatic cuts known as “sequestration.” The market was comfortable with this resolution, just as it would be with the others above, but experts we talk to don’t believe this option is the likely path this time.
While contentious partisan politics does raise the remote risk of a credit rating agency downgrade of U.S. debt, à la the 2011 variety, we think this is unlikely as well. We find it noteworthy that credit rating agencies in 2011 were threatening downgrades for months in advance and now they seem significantly less concerned, suggesting that they now understand the political posturing is temporary. Should a downgrade occur, however, it would be a catalyst to quickly pass a resolution to lift or suspend the debt ceiling and ultimately resolve the issue. Market reaction and discipline would, in essence, force a resolution quickly if this happened. This is the least comfortable path from our perspective, although it would not derail our belief that stocks will advance later in 2023 and on into 2024.
More extreme questions we get include our thoughts as to whether this drama risks a default on U.S. debt. We have never experienced a default on U.S. debt despite the more than 20 debt ceiling debates/raises since 2002 alone. The reason for this is compelling: U.S. government cash flow is adequate to comfortably cover the interest on U.S. debt.
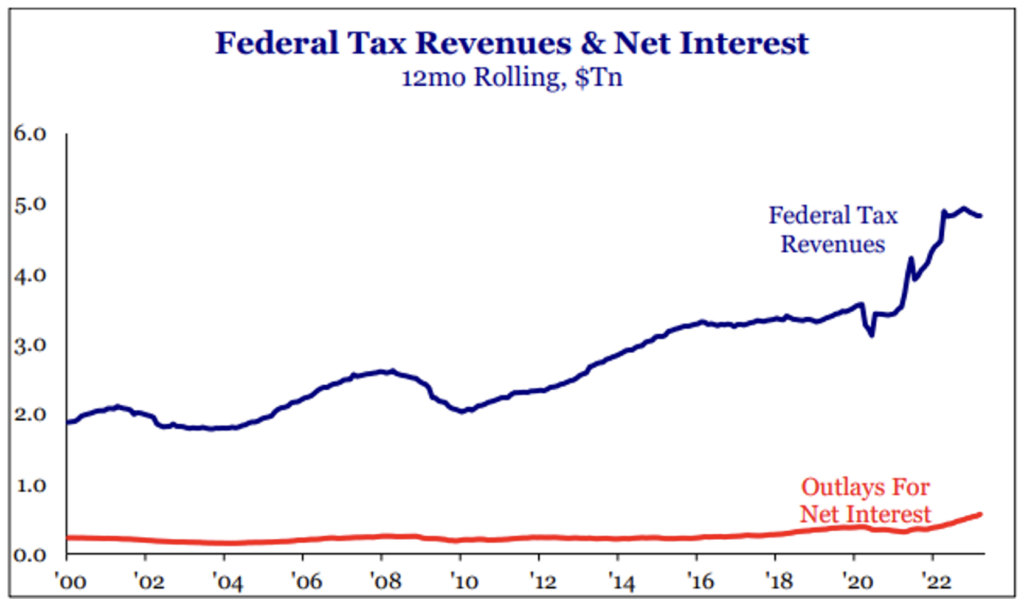
Source: Strategas
Bottom line, we see this issue as a not-uncommon occurrence that has been resolved in a handful of different ways over the course of time. We think the same will happen this summer when the X date approaches in the June/July time frame. It will create some heightened volatility that supports our “hold your ground” view on stocks in the near term but should not have lasting negative economic or market impact.
Wrap-Up
Being stuck in neutral isn’t fun. However, recognizing what stock market zone/stage you are in and exhibiting proper patience can be very rewarding in due time. Practice patience, be balanced between growth and value as leadership rotates, use bonds effectively for diversification and consider employing some level of active management to add value. This is the time to be a student of history, maintain discipline, stay invested at your normal/neutral long-term asset allocation target— and be boring!
Footnotes
1Bureau of Economic Analysis
2Factset
3Strategas
4-6FactSet
Disclosures
The S&P 500 Index is a market-value weighted index provided by Standard & Poor’s and is comprised of 500 companies chosen for market size and industry group representation. The index is unmanaged and cannot be directly invested into. Investing involves risk and the potential to lose principal. Past performance does not guarantee future results.
This commentary is limited to the dissemination of general information pertaining to general economic market conditions. The views expressed are for commentary purposes only and do not take into account any individual personal, financial, or tax considerations. As such, the information contained herein is not intended to be personal legal, investment, or tax advice or a solicitation to buy or sell any security or engage in a particular investment strategy. Nothing herein should be relied upon as such, and there is no guarantee that any claims made will come to pass. Any opinions and forecasts contained herein are based on the information and sources of information deemed to be reliable, but Mariner Advisor Network’s does not warrant the accuracy of the information that any opinion or forecast is based upon. You should note that the materials are provided “as is” without any express or implied warranties. Opinions expressed are subject to change without notice and are not intended as investment advice or to predict future performance. Consult your financial professional before making any investment decision.
Mariner Wealth Advisors is the parent company of Mariner Advisor Network, MIAN and MPS.
Jeff Krumpelman, CFA
Chief Investment Strategist and Head of Equities with Mariner Wealth Advisors.
Mariner Advisor Network is a brand utilized by Mariner Independent Advisor Network (“MIAN”) and Mariner Platform Solutions (“MPS”). Investment advisory services are offered through Investment Adviser Representatives registered with MIAN or MPS, each an SEC registered investment adviser. Registration as an investment adviser does not imply a certain level of skill or training. MIAN and MPS comply with the current notice filing requirements imposed upon registered investment advisers by those states where they transact business and maintain clients. MIAN and MPS have either filed notice or qualify for an exemption or exclusion from notice filing requirements in those states. Any subsequent, direct communication by MIAN or MPS with a prospective client shall be conducted by a representative that is either registered or qualifies for an exemption or exclusion from registration in the state where the prospective client resides. For additional information about MIAN or MPS, including fees and services, please contact MIAN/MPS or refer to the Investment Adviser Public Disclosure website (www.adviserinfo.sec.gov). Please read the disclosure statement carefully before you invest or send money.
For information about which firm your advisor is registered with, please refer to the Investment Adviser Public Disclosure website (www.adviserinfo.sec.gov) or the Form ADV 2B provided by your advisor.
Investment Adviser Representatives are independent contractors of MPS or MIAN and generally maintain or affiliate with a separate business entity through which they market their services. The separate business entity is not owned, controlled by, or affiliated with MPS or MIAN and is not registered with the SEC. Please refer to the disclosure statement of MPS or MIAN for additional information.