

“The stock market has predicted nine of the last five recessions.”
—Paul Samuelson
Wow, we can do without another six months like those in the first half of 2022. It was ugly and it wasn’t fun. But after an impressively profitable three-year stretch from 2019-2021, it wasn’t a total surprise either.
U.S. Equities Post Worst Quarter Since Pandemic
In June, the S&P 500 declined 8.3%.1 This lousy experience in the final month of 2022’s first 180 days helped make Q2 of 2022 the worst quarter for U.S. large-cap equities since the horrendous, pandemic-stricken Q1 of 2020 that included the 35% intramonth swoon1 in March of that year. On a YTD basis, the S&P 500 has declined approximately 21%, representing the worst-performing first half for this index since 1970.1
Other Asset Classes Took a Hit, Too
It wasn’t just large-cap U.S. stocks that suffered either. Pain was broad-based. Investment-grade bonds as measured by Bloomberg’s U.S. Aggregate Index fell more than 10% through June 30, thus posting their poorest start to a year in history.1
Equities and fixed income securities in emerging international markets declined, and cryptocurrencies were cut in half or more. The culprit for these various asset classes taking it on the chin, particularly when focusing on U.S. stocks, wasn’t simply a “we’re due” aura emanating from the robust returns of the prior three years. That’s part of it, but the primary catalysts for the timing of this correction were the many transitions going on in the economy and the financial markets this year. We saw a V-shaped economic recovery to something slower following the peak in COVID-19 spread, Federal Reserve accommodation transition to something more normal and cautious, and abnormally low inflation rise to a more probable normal and higher rate.
Factors Making Investors Jittery
It was news on those latter two issues in mid-June that spooked investors and inspired a sell-off going into the locker room at the midway point of the year—and that conjured up these undesirable headlines for the market so far this year. Specifically, the headline consumer price index figure of 8.6% was released on June 10.2 Not only did investors react negatively to the data, but this also woke up the Federal Reserve in a big way in their meeting the following week and motivated them to hike the federal funds rate by 75 basis points when they adjourned rather than the 50-basis-point raise they had anticipated employing prior to the June 10 CPI data release. These two news items have cemented in investors’ minds the fear that we are likely to experience a hyper-inflationary environment like that of the 1970s, which could cause the Fed to raise rates very aggressively to slow inflation as well as the economy and spark a serious recession.
Economists surveyed recently by The Wall Street Journal place an average 44% probability on a recession occurring in the U.S. in the next year. Our own Chief Economist Bill Greiner just increased his probability of recession from 30% to 40%.
Key Indicators Not Flashing Red Yet
From a capital markets perspective, what is our take on all this? First, let’s remember that based on the odds cited above, experts still place a 55%-60% chance that the Fed will be able to apply policy that calms inflation and engineers a slowing in the economy in such a way that we avoid recession. So, it is still not a base case expectation. The four major indicators we follow as signals of recession—slope of yield curve, manufacturing and service level activity, trend in the index of leading economic indicators, and key employment metrics—are not flashing red at present.
Clearly, the 21% swoon in U.S. stocks so far suggests that the stock market is anticipating a recession. After all, this level of performance technically triggers the so-called -20% threshold that characterizes a “bear market” often associated with periods of looming economic recession. How do we feel about this? Frankly, this data isn’t very helpful or predictive of future returns; it’s simply an observation of what has happened so far. There is a reason that the late famous economist, Paul Samuelson, is often noted for having said, “The stock market has called nine of the last five recessions.” While he said this back in the 1960s, and it proved surprisingly accurate over the next 60 years with the ratio of market downturns to recessions being fairly close, his point was this: the market often overreacts and gets it wrong more than 50% of the time.
U.S. Market Reality Versus Investor Fears
Remember the fears sparked in December 2018 when the S&P 500 fell 21%? Investors thought that tough tariff negotiations and shifting Fed policy would throw us into recession. Those fears were overblown. When investors eventually focused on the still-solid fundamental facts, not unlike what we see today, the market rallied the entire year of 2019, posting handsome returns and achieving new highs. Contrast this to the pandemic-laden 2020 period when the market fell 35% in a three-week period in March of that year. Again, the market anticipated a recession via the COVID-19-related economic shutdown. This time the market got it right… we had a severe recession. But what the market saw very quickly was that the stimulus check cavalry was on the way to our rescue to drive a V-shaped economic recovery the rest of 2020 and 2021. Hence, the market surged more than 90% over the balance of the year and quickly achieved new highs.
Again, this is the point… whether the market is right or wrong about its assessment of the trend, it is always forward looking and anticipating where the puck is going, not where it has been. In that regard, we see early signs that inflation is peaking, that supply chain bottlenecks are easing and that the Fed might not have to hike as much as currently feared.
We believe there’s a reasonable chance that worst-case outcomes, regarding inflation and Fed policy, can be avoided and a soft landing could still be achieved. But if we are wrong on this and we do experience a recession, it should be a mild one. A low 3.6% unemployment rate with positive earnings growth and stable credit markets certainly does not describe a deep recession/depression like we saw in the 1920s and 2007-2008.
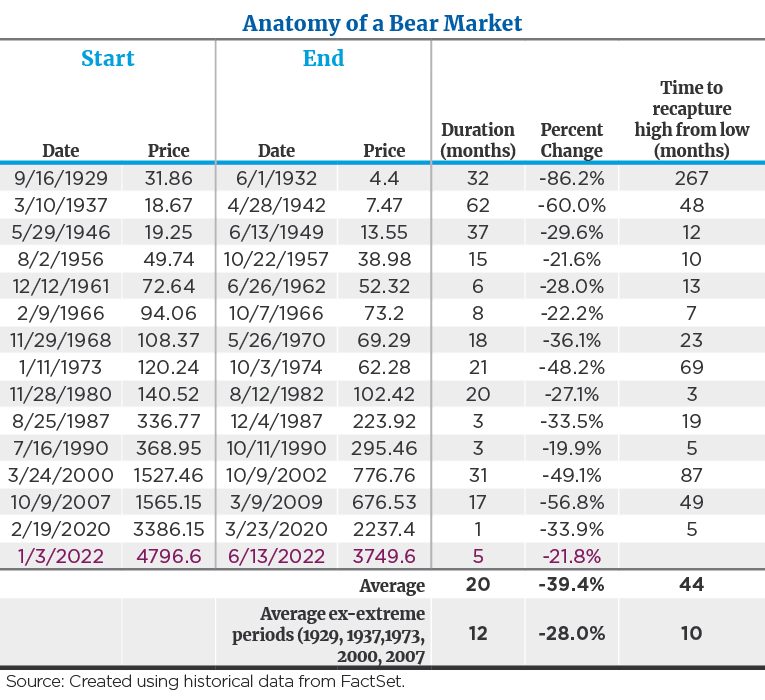
What History Tells Us About Recessions
The table below illustrates that if you exclude these extremely rare, once-in-a-lifetime periods of economic catastrophe and examine periods of mild recession, the S&P 500 has fallen 28% on average. With the market having fallen 21% so far this year, this data suggests that we’ve already suffered most of the pain. In fact, historically, the market has posted positive returns 45% of the time in the midst of recession. By the time you know you are in recession, it’s generally time to move on. Most of the damage occurs six to 12 months prior.3 Again, the market is forward looking.
For those who love historical data and stats, there is some good news in the poor showing of the market so far this year. In the years in which the S&P 500 has fallen by more than 15% in the first six months (1932, 1939, 1940, 1962 and 1970), it has risen by more than 24% in the second half.4 We are not predicting this type of result, but when we assess the current fundamental, valuation and technical backdrop to the market, we feel we are far closer to the bottom than the top. We feel that we can still achieve new highs sometime in 2023, representing significant upside. Patience is warranted.
“It’s Inflation, Stupid”: Is it 1950 or 1970?
Clearly, the focus of the world is on the trend in the inflation data at present, thus inspiring the title of this section, which echoes former President Bill Clinton’s comments on the driving force of the 1992 presidential election results: “It’s the Economy, Stupid.”
Here’s our updated take on the inflation front:
- While the headline CPI figure of 8.6% released on June 10 was disappointing, it caught 100% of the attention and made for concerning headlines. Additional detail in that report, along with other data released subsequently, shows a picture of peaking or calming inflation.
- Core inflation in that same data release fell from 6.5% to 6.0%.
- The Producer Price Index data, which was announced the following week, decelerated.
- The Core Personal Consumption Expenditure Price Index that the Fed monitors closely fell to 4.7% in the latest report at the end of June and has now fallen for three consecutive months.
- Commodity prices, including both oil and industrial metals such as copper, have noticeably declined in recent weeks.
- Lumber prices have fallen by 50% in the last month.5
- In the latest ISM manufacturing surveys and Federal Reserve regional surveys, delivery times for manufacturing companies have shortened, illustrating that supply bottlenecks are beginning to ease.
The data above shows a positive not negative trend and that is what the market cares about in time… trend, not absolute static conditions. The question is will this trend continue? Folks like instant gratification. At present, price pressures seem to be easing, just not quickly and measurably enough to satisfy investors’ appetite for improvement.
Investors Are Concerned About Hyper-Inflation
Investors fear that the persistent supply chain bottlenecks and stickier-than-hoped-for inflation will become a self-fulfilling prophecy and lead to a permanent rise in consumers’ inflationary expectations. And that this will result in a 1970s variety of hyper-inflation and associated wage-price spiral when we saw the prime lending rate at 20% and CPI rise by 15%.
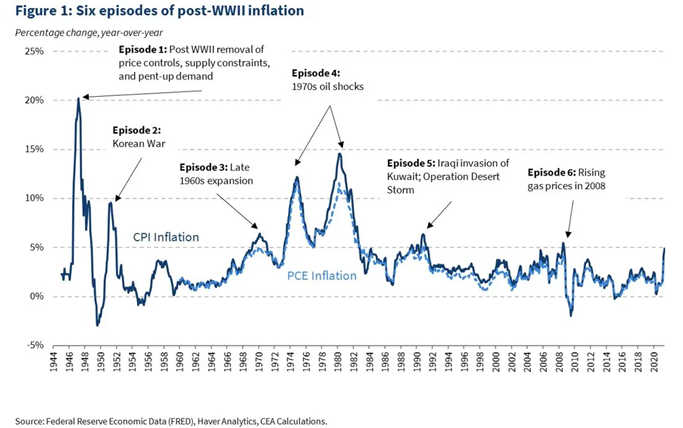
We’ve studied several of the periods of rising inflation in the past and believe there are quite a few parallels to 1950-1951. The U.S. was still rebuilding from World War II and transitioning from a guns to a butter economy when we were pulled into the Korean War. This exacerbated labor shortages and supply chain bottlenecks at the time. Inflation spiked from 2% to 10%, and the Fed needed to hike rates several times to slow things down and calm the price increases. Sound familiar? The Fed was successful in doing so, and recession was avoided or deferred until 1954. Inflation fell back to the 3% level in short order as supply chain and labor shortage issues eased. See the chart below that contrasts the ugly inflation experience in the 1970s to the more manageable case in the 1950s. Stay tuned on this front.
Why Hold Your Ground and Not Buy on the Dip?
I want to be clear that while we believe we are close to the bottom and see nice upside to the market over the next 12-15 months, we do not think this is immediate. Despite the still-favorable employment and spending picture that continues to drive positive earnings and the more favorable valuation of U.S. stocks, we know that investors must see more persistent and tangible signs of inflation slowing, as this would cause the Fed to moderate, and moderation typically leads to market recoveries. Until that occurs, they will be reluctant to put additional cash to work, and there is still downside risk in the midterm. While stocks are oversold, historically, they have gotten cheaper if you examine other periods of stress, so we find it premature to sound the “buy on dips” siren just yet. We will discuss this in more detail in our 2022 Mid-Year Crystal Ball webinar on July 21.
In the interim, here are the key observations and thoughts about positioning:
- Patience is a virtue.
- Active management could add value versus passive management.
- Blend both growth and value stocks. Growth stocks are not dead!
- Higher-quality companies with strong balance sheets should be an important component to the portfolio.
- Shorter-term bonds have appeal as rates have risen.
Wishing you well as we move into the second half!
Sources:
1FactSet
2Consumer Price Index Summary, U.S. Bureau of Labor Statistics
3YCharts
4LPL Financial
5Consumer Price Index Summary, U.S. Bureau of Labor Statistics, Personal Income & Outlays, May 2022, U.S. Bureau of Economic Analysis
Disclosures:
The S&P 500 Index is a market-value weighted index provided by Standard & Poor’s and is comprised of 500 companies chosen for market size and industry group representation.
Bloomberg Barclays Capital U.S. Aggregate Bond Index measures the performance of the U.S. investment grade bond market. The index invests in a wide spectrum of public, investment-grade, taxable, fixed income securities in the United States – including government, corporate, and international dollar-denominated bonds, as well as mortgage-backed and asset-backed securities, all with maturities of more than 1 year.
Indexes are unmanaged and cannot be directly invested into. Past performance is no indication of future results. Investing involves risk and the potential to lose principal.
This commentary is limited to the dissemination of general information pertaining to Mariner Platform Solutions’ investment advisory services and general economic market conditions. The views expressed are for commentary purposes only and do not take into account any individual personal, financial, or tax considerations. As such, the information contained herein is not intended to be personal legal, investment or tax advice or a solicitation to buy or sell any security or engage in a particular investment strategy. Nothing herein should be relied upon as such, and there is no guarantee that any claims made will come to pass. Any opinions and forecasts contained herein are based on information and sources of information deemed to be reliable, but Mariner Platform Solutions does not warrant the accuracy of the information that this opinion and forecast is based upon. You should note that the materials are provided “as is” without any express or implied warranties. Opinions expressed are subject to change without notice and are not intended as investment advice or to predict future performance. Consult your financial professional before making any investment decision.
Investment advisory services are provided through Mariner Platform Solutions, LLC (“MPS”). MPS is an investment adviser registered with the SEC, headquartered in Overland Park, Kansas. Registration of an investment advisor does not imply a certain level of skill or training. MPS is in compliance with the current notice filing requirements imposed upon registered investment advisers by those states in which MPS transacts business and maintains clients. MPS is either notice filed or qualifies for an exemption or exclusion from notice filing requirements in those states. Any subsequent, direct communication by MPS with a prospective client shall be conducted by a representative that is either registered or qualifies for an exemption or exclusion from registration in the state where the prospective client resides. For additional information about MPS, including fees and services, please contact MPS or refer to the Investment Adviser Public Disclosure website www.adviserinfo.sec.gov). Please read the disclosure statement carefully before you invest or send money.
Investment Adviser Representatives (“IARs”) are independent contractors of MPS and generally maintain or affiliate with a separate business entity through which they market their services. The separate business entity is not owned, controlled by, or affiliated with MPS and is not registered with the SEC. Please refer to the disclosure statement of MPS for additional information.