

“Things turn out best for the people who make the best of the way things turn out.” – John Wooden
Despite Skepticism, the Rally Is Real
The S&P 500 got off to a good start in the second half of 2023, rising roughly 3% in the month of July.1 The Index has risen more than 1,000 points from the 3,577 low on October 12, 2022, up to the closing price level of 4,582 on July 31, 2023—the equivalent of a 28% run.2 As we noted last month and in our Midyear 2023 Crystal Ball Update, we believe this rally is real and based on solid fundamental trends and resolutions to various wall of worry items this year (inflation, debt ceiling, policy mistakes, banking scares, etc.) that have been better than feared and less than worst case.
The positive momentum that appeared in the earnings and economic data going into the locker room at the June 30 half time break continued in July. In this first month of the second half, we learned that real gross domestic product in the second quarter grew at a larger-than-expected 2.4% pace, driven by strength in consumer spending as well as by surprisingly robust capital spending that is underappreciated by most folks.3 Inflation continued to calm, and earnings news continued to trend in positive fashion with more than 80% of companies beating expectations in their second quarter earnings releases.4 All this while investors have remained skeptical—a perfect cocktail to keep the rally going! How can this be? Weren’t we supposed to have an ugly recession and earnings implosion by now with very poor returns in 2023?
Guided by the Fundamentals
Cutting through all the minute detail and metrics, through our disciplined research process we concluded that the various wall of worry items on investors’ minds would be solved or evolve in better-than-feared fashion. We also believed that the fundamental data, valuation levels and longer-term technical price trends (the FVTs, as we call them) of the market remained relatively constructive, despite the dire prognostications out there.
Fundamentals, Valuation and Technicals
| Rating | |
|---|---|
| Fundamentals: Data that impacts revenues and earnings | Neutral |
| Economic Trends | O |
| Earnings Trends | O/– |
| Federal Reserve Policy | O/– |
| Interest Rate Trends | O/+ |
| Real Rates | + |
| M&A/IPO Activity | O |
| Credit Spreads | + |
| Valuation: How expensive stocks are | Neutral |
| Price to Earnings | O |
| Dividend Yields vs. Interest Rates | O |
| Price to Sales | O |
| Earnings Yield to Bond Yield | O |
| Technical Price Trends: Quality of trend in market | Neutral |
| Advance/Decline | O |
| Stocks above 200-day Moving Average | O |
| Sentiment | O |
| Long-Term Trend | O |
| Sector/Individual Stock Trends | O |
+ Positive, O Neutral, – Negative
Metrics are ranked positive, neutral, or negative based solely on the firm’s interpretation of market data, are subject to change at the firm’s discretion with no notice to you, and are not a guarantee of future results. They are presented for information purposes only.
At minimum, we rated the FVTs as neutral and trending in a more positive direction… you can see these ratings in the table above. In contrast, much of the rest of the world saw them likely to trend in an absolutely horrible direction, given ugly headlines, rather than simply monitor and accept these data items for what they were in the present—neutral, not horrible. Many of the “experts” and masses had become too negative, in our view. As a result, when the less-than-worst-case news finally hit the newswires in a consistent, steady flow through the second quarter via various data releases, the market cheered as we expected. It’s not more complicated than that.
Our Positive Thesis Prevails
We believe that we promoted a productive message during the sell-off in 2022 and throughout this early recovery in 2023. We hope our reading audience agrees. For our part, we recommended that clients pare back their stock allocation to their normal long-term target beginning in January 2022 if the robust returns of the prior three years had taken their stock exposure to well above normal. We suggested “holding your ground” at this normal or neutral stock exposure level. We have maintained our 4,500 price target on the S&P 500 by year-end 2023. We saw upside to as high as 4,800 by year-end 2023 if everything fell into place in surprisingly positive fashion regarding these transitional issues in the economy and on the policy front. The bear camp had become uber-negative going into 2023 versus the more benign backdrop suggested by the metrics, in our view. We are pleased that a less-worse trend in the data and more positive outcomes on policy issues prevailed than expected by this bearish camp, in keeping with our relatively positive thesis for 2023.
Growth Stocks Outperform
In terms of a couple of other interesting observations in 2023’s first half, those “long duration” growth stocks that many experts panned and recommended abandoning in the midst of Federal Reserve rate hikes ended up almost doubling the return of the S&P 500 in the first six months of the year—32% gains for the tech-laden Nasdaq versus the 16% return for the S&P 500.5 The leading sectors for the S&P 500 were by far the growth-oriented technology and consumer discretionary stocks that soared well over 40% and 30%, respectively.6 The outperformance of such growth stocks plateaued a bit in July, but we are glad we recommended holding on to positions in growth stocks and even increasing them rather than running away and into the arms of the value-oriented cyclicals in extreme fashion as many implored.
Patience and Focus Are Key
Going into this year, the Equity Team tried to channel the late John Wooden a bit. What an incredible basketball coach during the UCLA dynasty in the 1960s and ’70s. He happened to hail from the Midwest, and in his early years coached high school basketball in my hometown in Northern Kentucky before becoming so famous at the college level. The quote attributed to him at the beginning of this month’s commentary has a bit of a “turn lemons into lemonade” tone to it. That’s what we saw in 2023… an opportunity to make some lemonade, both in the general market and in these growth stocks.
When I was growing up, John Wooden’s autographed “The Pyramid of Success” hung above my desk in my bedroom. The building blocks of his pyramid included honesty, reliability, patience and adaptability. The latter two are so important in the investment world. Staying focused and tied to the data and making those adjustments to the environment at hand are hard to do, yet key. Above all, patience is critical… patience in recognizing that the rewards might not come right away and patience not to become so annoyed or so bold as to make extreme changes that could derail performance if you are wrong. Stick with the discipline and make small, measured adjustments as required. That’s what we try to do.
Maintaining Our “Hold Your Ground” View
So, here we are above 4,500 as I pen this commentary in early August when our base case for the entire calendar year 2023 called for a likely year-end target of exactly that—4,500—and an optimistic return of 4,800. You’re probably asking, “What now, Jeff and team… does that mean there’s little return going forward, then?” We have a couple of thoughts on this point. We maintain these calendar year-end expectations, and we have extended our next 12-month view. As shown in the table below, we place 70% odds that the S&P 500 will trade somewhere between 4,800 and 5,000 by June 30, 2024, which represents decent double-digit returns, including dividends in both cases over the upcoming 12 months.
| Market Scenarios | Probability | S&P Level | Price Return | Total Return |
|---|---|---|---|---|
| Optimistic case | 10% | 5,000 | 12% | 14% |
| Base case | 60% | 4,800 | 8% | 10% |
| Disappointing case | 20% | 3,900 | -12% | -10% |
| Pessimistic case | 10% | 3,300 | -26% | -24% |
Optimistic Case: Based on getting some multiple expansion and a P/E of 19.2x FactSet consensus 2024/2025 earnings average of $260.
Base Case: Based on P/E of 18.5x FactSet consensus 2024/2025 earnings average of $260.
Disappointing Case: Based on P/E of 16x FactSet consensus 2024 earnings of $246. Inflation and higher rates persist, multiple contracts.
Pessimistic Case: Based on a lower P/E of 15.5x earnings compress and come in at $215 in 2024.
IMPORTANT: The target return expectations regarding the likelihood of various investment outcomes are hypothetical in nature, do not reflect actual investment results, and are not guarantees of future results.
These price target expectations are for the next 12 months through June 2024. For all the scenarios outlined above, the price return is determined using a starting level of 4,450 as the closing price for the S&P 500 on June 30, 2023, and the total return incorporates the impact of dividends, which we are using a flat 2% expected dividend – the actual dividend yield will vary. Consensus earnings projections based on information obtained from FactSet. The environment set forth above is an estimate based upon research and formulation of estimates. Scenarios are subject to change at the firm’s discretion with no notice to you.
We are gratified that we maintained this more positive target for the S&P 500 than a number of peers in 2023 but have admitted in earlier writings that we didn’t know if the path to 4,500 or so would be in “three yards and a cloud of dust” style, very rocky and volatile in nature or very swift. It’s turned out to be even swifter than we imagined. We remain positive because the data is solid, inflation continues to calm and the Fed appears to be just about done with the hikes. Our 4,800 to 5,000 target assumes only modest economic growth, consensus earnings and interest rates that hover at close to existing levels. In other words, quite reasonable and rather sober assumptions.
We do show lower-probability disappointing and pessimistic targets, but we see them as unlikely and requiring economic and earnings slowdowns far worse than are visible at present as well as a harsh reversal in the improving inflation data. All this said, we would not be surprised to see a pause in the market or a slight temporary pullback to the 3,900 level before advancing to new all-time highs in that 4,800 to 5,000 range after coming so far so soon. Hence, our continued hold your ground view to maintain stock allocations at normal or neutral long-term strategic targets.
Inflation Trends Heading Down
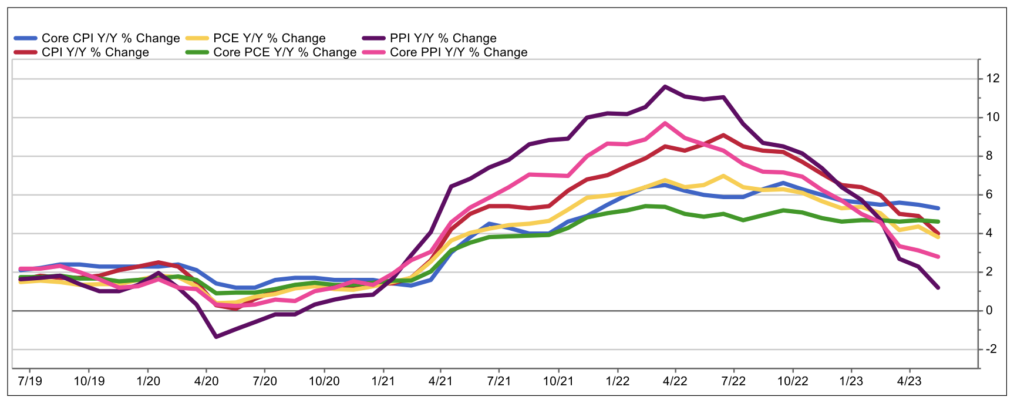
You might be wondering what gave us confidence to stay positive on the market in the early going in 2023 and vigilant in our expectation that inflation would calm. These two go hand in glove and are key to the Fed being able to end its rate-hike campaign. The table and line graph below show the alphabet soup of various inflation metrics, ranging from the Consumer Price Index (both headline and core) to the Personal Consumption Expenditures Price Index (both headline and core) to the Producer Price Index (both headline and core). Each of these is calculated differently, but they all have one thing in common: they have peaked and are heading down.
We know from studying history that this is all that is required for the market to rally… it needs to see inflation peak and start to decline. The inflation data doesn’t need to be perfect—it just needs to be better than it was. To wit, in the six periods of surging inflation post-1950, the stock market advanced significantly after the inflation data peaked, even if it still was higher than preferred. That’s what happened this year. As you can see in the table, CPI peaked at 9.1% in the summer of 2022 and per the table was down to the 4.0% level in May. Per June’s data, it is now down to 3%. The Producer Price Index, which is a leading indicator of future CPI (if producer prices of finished goods fall, so too in lagged fashion do consumer prices of final goods), is only running at 1.2% on a year-over-year basis as of June. This is very comforting and gives us confidence to expect better things to come.
Inflation Trends Since 2019
| Peak Y/Y Change | Current Y/Y Change | Peak to Current Change | Month Peaked | |
|---|---|---|---|---|
| CPI | 9.1% | 4.0% | -5.1% | June ’22 |
| Core CPI | 6.6% | 5.3% | -1.3% | Sept. ’22 |
| PCE | 7.0% | 3.8% | -3.2% | June ’22 |
| Core PCE | 5.4% | 4.6% | -0.8% | Feb. ’22 |
| PPI | 11.6% | 1.2% | -10.4% | March ’22 |
| Core PPI | 9.7% | 2.8% | -6.9% | March ’22 |
Source: FactSet, U.S. Department of Labor’s Bureau of Labor Statistics
Capital Spending Helps Avert Recession
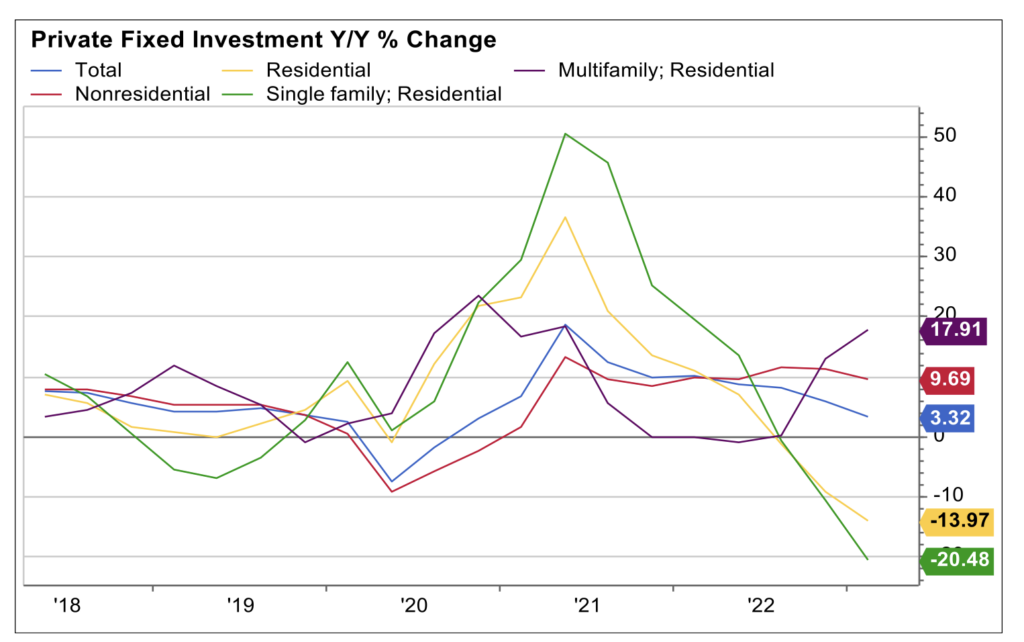
The other table we want to share is one illustrating the strong capital spending boom underway in the U.S. as companies “reshore” supply chains and build out infrastructure to prevent bridges from falling into U.S. rivers. Congress has passed three bills in the past year that are driving trillions of dollars in capital spending, which has been a contributor to keeping us out of recession. This will be recognized more and more over time, in our view. The table and graphs below capture this unappreciated economic catalyst.
| Q1 2023 | Q1 2022 | % Change | |
|---|---|---|---|
| Private Fixed Investment | $4,560 | $4,414 | 3% |
| Nonresidential | $3,538 | $3,225 | 10% |
| Residential | $1,023 | $1,189 | -14% |
| Single Family | $373 | $469 | -20% |
| Multifamily | $99 | $84 | 18% |
Source: FactSet, U.S. Department of Labor’s Bureau of Economic Analysis
Construction of single-family residential homes may have softened for a bit, but multifamily has been on fire as has the far larger spend on nonresidential construction and related plant and equipment. This is a big deal and gives us confidence in the aggregate stock market level as well as confidence as to what types of stocks to own.
Wrap-Up
While reward may not be immediate in the second half of 2023, we look for solid returns in the next 12 months and suggest embracing the tenets of John Wooden: patience, reliability, discipline and adaptability in small doses. These should be rewarded in the coming quarters.
Footnotes
1,2FactSet
3U.S. Treasury Department
4-6FactSet
The S&P 500 Index is a market-value weighted index provided by Standard & Poor’s and is comprised of 500 companies chosen for market size and industry group representation.
The Nasdaq Composite Index is the market capitalization-weighted index of over 3,300 common equities listed on the Nasdaq stock exchange.
The indexes are unmanaged and cannot be directly invested into. Past performance does not guarantee future results. Investing involves risk and the potential to lose principal.
This commentary is for informational and educational purposes only. The views expressed do not take into account any individual personal, financial, or tax considerations. As such, the information contained herein is not intended to be personal legal, investment, or tax advice or a solicitation to buy or sell any security or engage in a particular investment strategy. Nothing herein should be relied upon as such, and there is no guarantee that any claims made will come to pass. Any opinions and forecasts contained herein are based on the information and sources of information deemed to be reliable, but we do not warrant the accuracy of the information that any opinion or forecast is based upon. You should note that the materials are provided “as is” without any express or implied warranties. Opinions expressed are subject to change without notice and are not intended as investment advice or to predict future performance. Consult your financial professional before making any investment decision.
Mariner Advisor Network is a brand utilized by Mariner Independent Advisor Network (“MIAN”) and Mariner Platform Solutions (“MPS”). Investment advisory services are offered through Investment Adviser Representatives registered with MIAN or MPS, each an SEC registered investment adviser. Registration as an investment adviser does not imply a certain level of skill or training. MIAN and MPS comply with the current notice filing requirements imposed upon registered investment advisers by those states where they transact business and maintain clients. MIAN and MPS have either filed notice or qualify for an exemption or exclusion from notice filing requirements in those states. Any subsequent, direct communication by MIAN or MPS with a prospective client shall be conducted by a representative that is either registered or qualifies for an exemption or exclusion from registration in the state where the prospective client resides. For additional information about MIAN or MPS, including fees and services, please contact MIAN/MPS or refer to the Investment Adviser Public Disclosure website (www.adviserinfo.sec.gov). Please read the disclosure statement carefully before you invest or send money.
For information about which firm your advisor is registered with, please refer to the Investment Adviser Public Disclosure website (www.adviserinfo.sec.gov) or the Form ADV 2B provided by your advisor.
Investment Adviser Representatives are independent contractors of MPS or MIAN and generally maintain or affiliate with a separate business entity through which they market their services. The separate business entity is not owned, controlled by, or affiliated with MPS or MIAN and is not registered with the SEC. Please refer to the disclosure statement of MPS or MIAN for additional information.